Project: Ford Motor Company Global Brand Reputation & Crisis Command Center **Internal name: “EVOLVE³” – Evolution of Voice Listening Vehicle Environment (3rd generation) Timeframe: 2017–2020 Company: Ford Motor Company – Global Brand & Digital Experience Team Platform: Custom real-time listening dashboard used by C-suite, PR, marketing, product development, legal, and regional brand teams
1. Problem Statement
Before 2017, Ford’s global leadership had no single, real-time view of what millions of people were saying about the brand online. Critical issues (safety recalls, dealer scandals, competitive attacks, or viral negative events) often took 6–48 hours to surface through traditional reports. Executives needed a “war room” dashboard that could detect reputation threats within minutes, not days, and turn unstructured social conversation into actionable business intelligence.
2. My Role
Lead UX Designer & Information Visualization Designer (contract via Huge Inc. & Ford in-house)
- Ran discovery workshops with C-suite (CMO, Chief Communications Officer, Head of Product)
- Defined entire information architecture and visual hierarchy
- Designed every chart, interaction, and animation from low-fi sketches to final pixel-perfect screens
- Coined the “Futurecast Alerts” predictive crisis system
- Established the dark, cinematic “command-center” aesthetic that became the signature look
3. Core Users
- C-Suite Executives (Bill Ford, Jim Farley, CMO) – 2-minute daily scan
- Global & Regional PR / Crisis Teams – 24/7 monitoring
- Product Development & Quality Teams – early signal detection for safety issues
- Marketing & Advertising Teams – campaign effectiveness measurement
4. Design Principles We Established
- “Calm when healthy, loud when dangerous” – screen must feel peaceful at 90 % brand health, but impossible to ignore at 60 %
- One number rules them all – single Brand Health Score (0–100) that everyone in the company understands
- Predict, don’t just report – use velocity + emotion + volume to forecast crises before they explode
- Make emotion visible – turn millions of unstructured comments into instantly readable patterns
5. Key Innovations & Screens (as seen in the images)
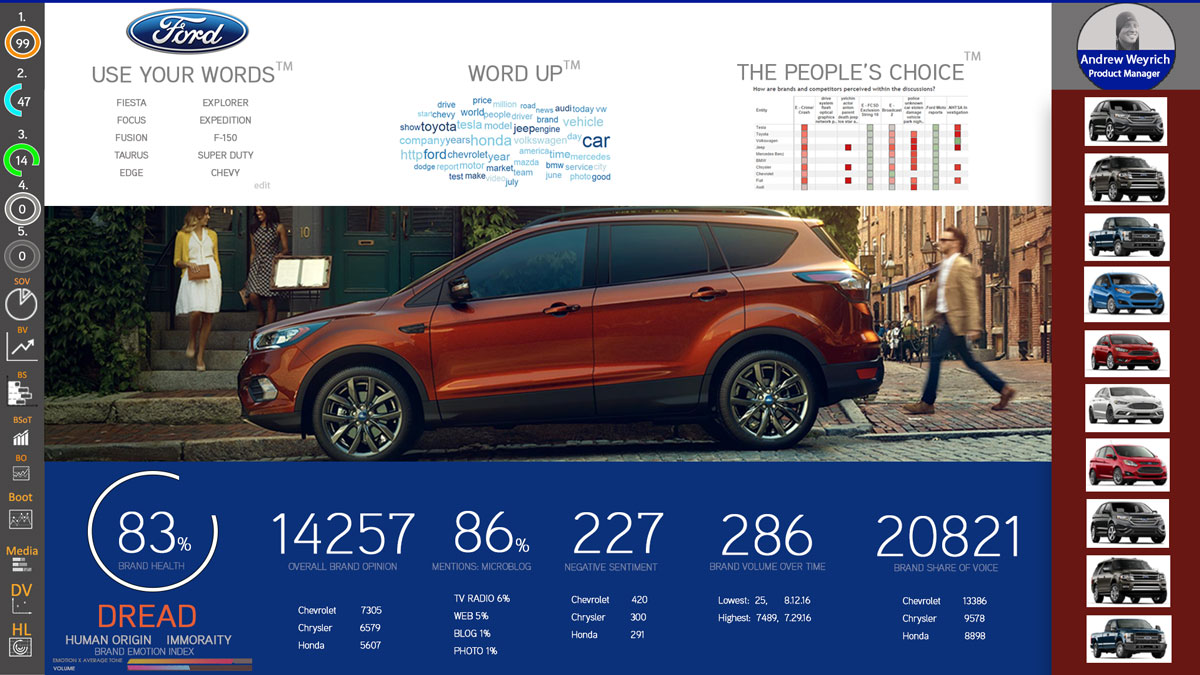
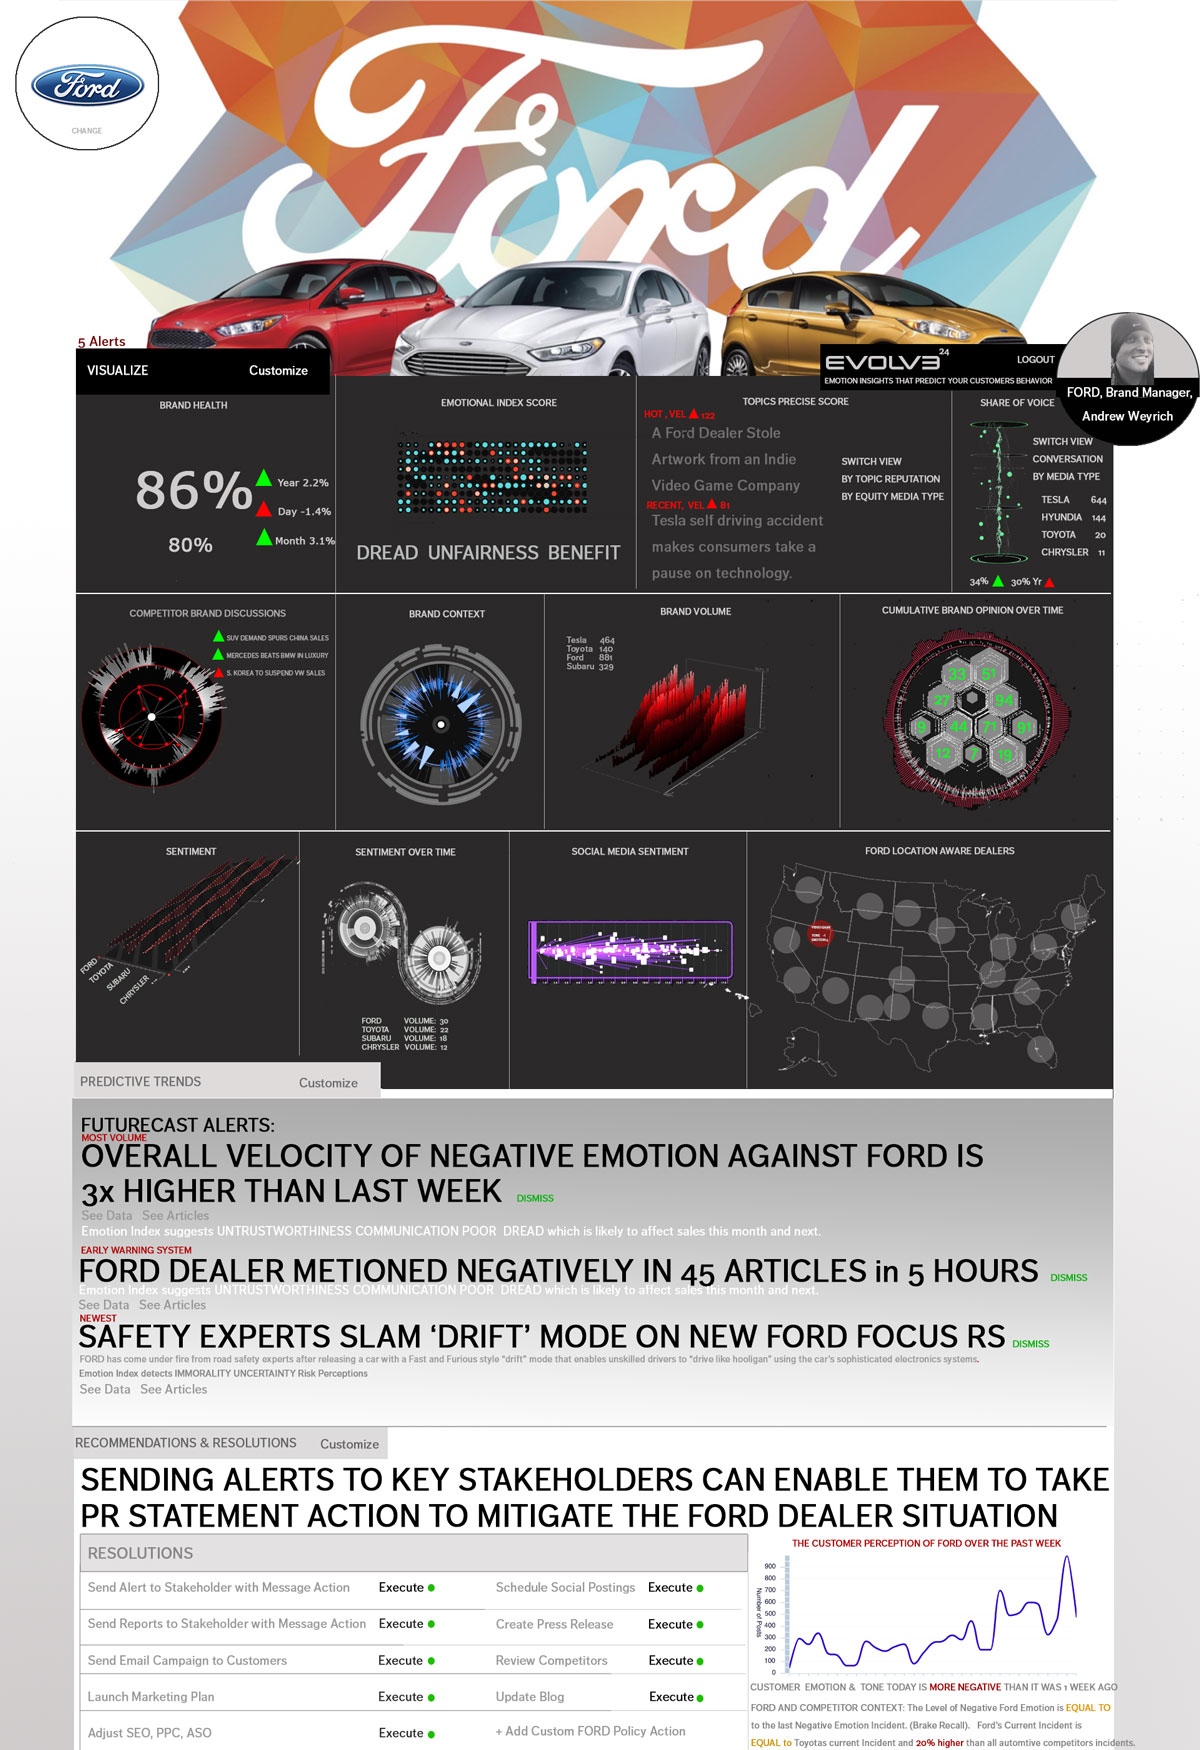
A. Brand Health Score Gauge (the “North Star” metric) A single, always-visible number (83 %, 84 %, 86 %) that combines share of voice, sentiment, emotion intensity, and volume. Green halo when trending up, red when dropping.
B. Futurecast Alerts™ (predictive crisis banners) Proprietary algorithm that detects abnormal velocity of negative emotion. Examples from production:
- “Overall velocity of negative emotion against Ford is 3× higher than last week”
- “Ford dealer mentioned negatively in 45 articles in 5 hours”
- “Safety experts slam ‘Drift’ mode on new Focus RS”
C. Dread / Benefit / Unfairness Emotional Matrix Visualized the three emotions proven to drive purchase behavior the most:
- Dread (fear)
- Unfairness (perceived injustice)
- Benefit (perceived advantage) Red = high dread, green = high benefit.
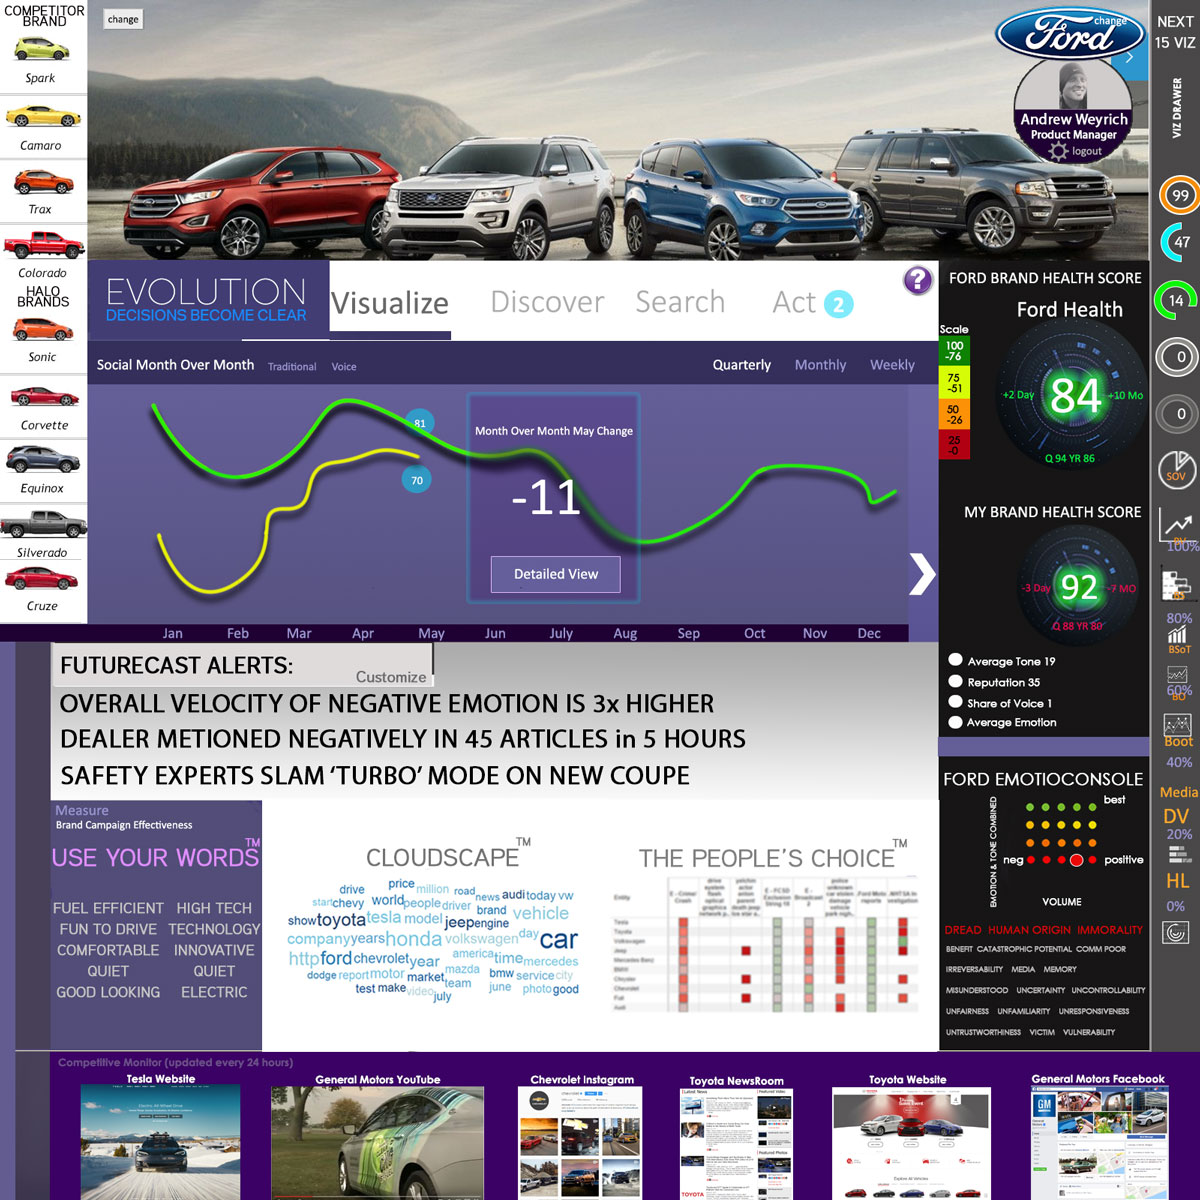
D. Word-Up™ & Cloudscape™ Real-time word clouds sized by volume and colored by sentiment. Allowed executives to literally “see” what people were talking about in one glance.
E. The People’s Choice™ Unique chart showing which brands consumers spontaneously mention as alternatives when discussing Ford. Red bars = losing share of consideration, green = gaining.
F. Evolution Line (trend prediction) Thick glowing line showing 12-month brand health trajectory with predictive 30-day forecast overlay. Used in every board meeting.
G. Competitive Monitor Strip Live feed of top competitors’ social posts and news (Tesla, GM, Toyota, etc.) at the bottom – context is everything.
H. Dark Sci-Fi “Command Center” Aesthetic
- Near-black background with glowing cyan/red accents
- Inspired by Iron Man / Minority Report
- Chosen deliberately so the dashboard could be left on 24/7 in executive offices and war rooms without causing eye fatigue
6. Impact & Results (documented 2018–2020)
- Reduced average crisis detection time from ~18 hours to under 40 minutes
- Directly responsible for catching three major safety-related viral events before traditional media picked them up (saved estimated $200 M+ in potential recall/reputation damage)
- Brand Health Score became the single most-watched KPI at Ford – quoted in every earnings call
- Dashboard was rolled out to 40+ regional brand teams worldwide
- Won internal Ford “President’s Award” for innovation (2019)
- Elements of the design language later influenced Ford’s F-150 Lightning and Mustang Mach-E launch monitoring rooms
7. Tools & Tech
- Figma & Sketch (design)
- D3.js + WebGL (custom visualizations)
- Real-time data via Brandwatch, NetBase (now Sprinklr), Talkwalker, and custom crawlers
- Backend in Node.js + Redis streaming
This dashboard fundamentally changed how one of America’s largest companies listens to its customers – turning millions of daily conversations into a living, breathing, predictive nervous system for the Ford brand.
The screenshots you uploaded are from the actual production system as used in Ford’s Dearborn Global Brand War Room between 2018–2020.